Proposition 2 ½ was passed in 1980 and forced changes to the myriad ways Massachusetts residents were taxed. Known primarily for its limiting effect on property taxes, Prop 2 ½ also capped vehicle excise taxes and put the brakes on funding demands from local school committees created with little or no input from municipalities. The law also did away with the “unfunded mandate” whereby cities and towns were forced to implement policies promulgated by the state without the funds with which to do so.
Though most people are familiar with Prop 2 ½, many don’t entirely understand it. Indeed, comprehending all aspects of the law can pose a challenge to all but the most stalwart tax nerds. Though its precepts make financial sense, the multiple types of tax levies and exclusions are baffling and the ways the 2 ½ % increase is applied and used in taxation is commonly misunderstood.
Fear not. To simplify this important issue, I’ve put together this little post to clarify this somewhat complex--but extremely important--aspect of the property tax picture.
The Division of Local Services has a useful downloadable guide on Proposition 2 ½ that strives to explain the befuddling law to municipal officials. It truly is the best I’ve seen and I’ll refer back to it often as I plow through the ins and outs of Prop 2 ½.
All About Levies
The Tax Levy
Before Prop 2 ½, there was only the good, old-fashioned tax levy--the amount in taxes raised by the town to help fund its annual budget. As discussed in an earlier post, residential taxes make up about 94% of Shutesbury’s tax levy and 73% of its annual budget.
In many communities, escalating tax levies helped fuel the Proposition 2 1/2 referendum vote famously put forward by the group Citizens for Limited Taxation. Among the changes made to the local taxation system were restrictions to the tax levy itself.
Levy Ceiling
The caps on tax levies brought about by Prop 2 ½ now meant that municipalities could only tax up to 2.5% of the “full and fair cash value” of the combined values of all real and personal property in the city or town. This amount is the levy ceiling. This is the absolute maximum a municipality can levy in any given year.
➤Total value of all real and personal property in town * 2.5% = Levy ceiling
For Shutesbury, the formula will look like this once state aid is known and personal and real property values are certified by the Commissioner of Revenue:
➤$227,578,443 * 2.5% = $5,689,461
Levy ceilings can, and often do, change from year to year as property values increase (or decrease), the values of new properties are added to, and the value of demolished properties are subtracted from the tax base.
Levy Limit
Below the levy ceiling lurks the levy limit.
While the levy limit can never exceed the levy ceiling, cities and towns generally do not tax residents right up to the levy ceiling. The levy limit is the amount up to which municipalities are allowed to levy taxes each year. This amount also changes from year to year and is based on the previous fiscal year’s levy limit.
How does a levy limit increase, you ask? Start with the last fiscal year’s levy limit and multiply by 2.5%, the maximum allowed annual increase for every municipality. Add this amount to the prior levy limit. Add in the new growth, which is the amount of new development, additions to existing properties, new personal property, and tax-exempt properties being returned to the tax rolls (through a sale, for example).
➤Prior year’s levy limit * 2.5% = Maximum increase allowed each year
➤Maximum allowed increase + Prior FYlevy limit + New growth + Overrides (if applicable) = Current FY levy limit
Plugging in Shutesbury’s numbers from the revenue budget for fiscal year 2022:
$5,649,760 * 2.5% = $141,244
$141,244 + $5,649,760 + $10,000 (New Growth) = $5,801,004 (LEVY LIMIT)
The new levy limit of $5,801,004 is still not final; the town has a few more additions and subtractions to do.
$5,801,004 + $31,638 (Debt Exclusion) - $513,080 (Excess Levy Capacity) - $40,000 (Overlay) = $5,279,562 (TOTAL TAX LEVY)
In the FY 2022 Revenue Budget document, the Debt Exclusion (line 16) is for a 10-year Capital Plan for the Regional School system;
The Excess Levy Capacity (line 19) is the difference between line 17, Maximum Allowed Levy ($5,832,642), and line 20, the Tax Levy ($5,319,562);
The Overlay (line 22) is the amount of money set aside for the fiscal year to make up any revenue lost through tax abatements and exemptions.
Whew. Is your head spinning yet?
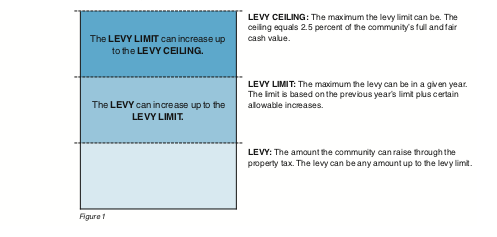
This succinct graphic, courtesy of the Massachusetts Division of Local Services’ Levy Limits: A Primer on Proposition 2 ½, is helpful when trying to visualize how the levy types discussed relate to each other
Communities are not required to levy right up to the levy limit if their budgetary needs do not oblige them to do so. If the tax levy is below the levy limit, the amount not levied is called “excess levy capacity” and goes untapped for that particular budget year. Though this amount is not accessible after the tax rate is set, next year’s levy limit is still based on the prior year’s levy limit, not the actual tax levy. In other words, communities are not penalized the following year for fiscal conservatism.
Municipalities are also not restricted by a decision not to levy up to the levy limit in any given year. If a town or city chooses, it can levy taxes right up to its limit the next year and any subsequent year. It is a decision made on an annual basis and is not impacted by the prior years’ decision.
Is excess levy capacity a good thing? Can cities and towns levy above the levy limit or levy ceiling? The answers to these and other burning questions will be answered as I continue to plumb the depths of Proposition 2 ½.
Weekly Factoids:
Despite the restrictions of Proposition 2 ½, Massachusetts ranks 34 out of the 50 states for the lowest effective tax rate.
Hawaii is No. 1 for the lowest effective tax rate and Alabama is No. 2; Hawaii’s median home value is the highest at $615,300 and Alabama’s is the third lowest at $142,700 (only Kentucky and Indiana are lower at $141,000 and $141,700).
Source: WalletHub


No comments:
Post a Comment