Friday, July 30, 2021

Cash Reserves: Shutesbury Crushes Leverett


When it comes to municipal savings and reserves, there are two major players: Free Cash and Stabilization. The Massachusetts Division of Local Services (DLS) advises municipalities to create policies relating to such reserve funds to keep a cash cushion on hand in case of an emergency or financial crisis. Healthy reserve fund balances can make borrowing cheaper and easier for municipalities, as well.


Free Cash


Free Cash is money left over at the end of the fiscal year. The state must certify these funds before the town or city can use them as a revenue source for the next fiscal year’s budget. Certification takes place after June 30 and may not be completed until several months later, though the amount is considered “certified” as of July 1 of the current fiscal year. The Division of Local Services’ Technical Assistance Bureau suggests municipalities generate Free Cash at a rate of 3% to 5% of its yearly operating budget.


Free Cash is used exclusively for one-time expenses and to bolster stabilization accounts. The state frowns on using Free Cash to fund operating budgets.


Stabilization


Cities and towns can create several stabilization accounts, each with a particular purpose. Leverett has at least one Stabilization account; Shutesbury has both Stabilization and Capital Stabilization accounts. The DLS encourages the practice of generating multiple stabilization accounts, since it “stabilizes” a community’s finances, making an unexpected or emergency expense less apt to cause a fiscal crisis.


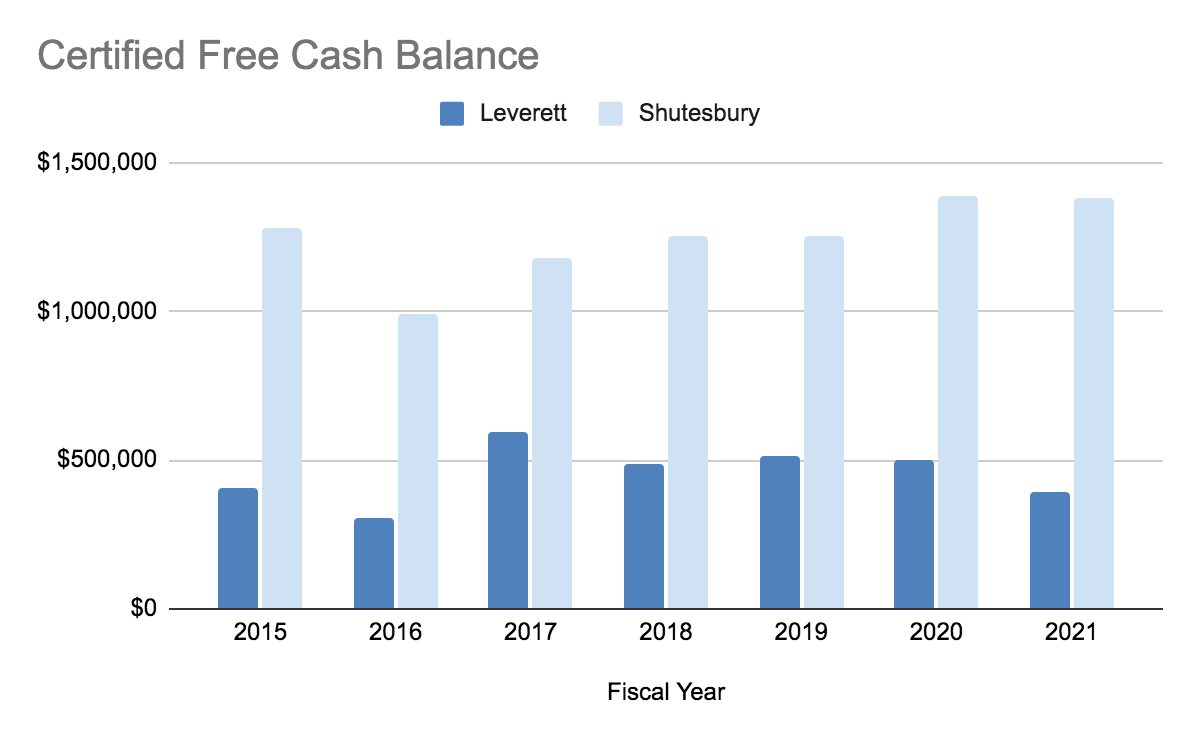
Free Cash: Leverett vs. Shutesbury


Since 2015, both Leverett and Shutesbury have maintained certified Free Cash levels of more than the suggested 3% to 5% of the town’s total annual budget. Where Leverett has had more of a struggle doing so, Shutesbury’s Free Cash is bursting at the seams.


From 2015 to 2021, Leverett’s Free Cash fund varied from a low of 4.90% in 2016 to a high of 9.18% in 2017. 


During the same time period, Shutesbury’s percentage of certified Free Cash ranged from a low of 15.28% to an astonishing high of 21.53% of the town’s operating budget. For 2021, free cash was only slightly lower, at 19.73%.


What do Leverett’s and Shutesbury’s Free Cash levels look like in dollars? For last year, Leverett had $391,909 in its coffers, while Shutesbury’s fund totaled an impressive $1,378,767.


Why is there such a yawning chasm between the two towns’ Free Cash funds? It wasn’t a disparity between annual budget totals; both towns had budgets of approximately $6.9 million that year. And, despite the jaw-dropping difference in the two funds, Leverett was, at 5.60% of its budget, comfortably above the percentages suggested by the DLS.


It seems that Shutesbury just likes to save more than Leverett does. A lot more. Some might call it cash hoarding.


Shutesbury’s 19.73% represents a level of saving that seems exaggerated, particularly when you realize that taxpayers foot the bill for this account-padding. Fiscal year 2021 was also a pandemic year, which meant hardship for some residents. The Finance Committee acknowledged this by using $220,000 of Shutesbury’s Free Cash to lower the tax rate by $1.00.


For the current fiscal year, the tax rate rose to $23.37 from the previous year’s $22.61 even as the town declined to use Free Cash to pay for the Locks Pond Road culvert repair, electing to borrow the money instead.


Stabilization


When it comes to Stabilization, Leverett steadily increased its funding levels between 2016 and 2020, while Shutesbury maintained fairly high levels (between 14.29% and 15.63% of the annual budget) for the first three years before dropping off in 2019. Shutesbury’s appropriation was a mere 8.07% that year, and 10.17% in 2020. By contrast, Leverett’s 2020 appropriation was a robust 12.52%.


Overall, Shutesbury’s cash cushion is considerably larger than Leverett’s. Saving money for a rainy day is good fiscal policy, but too much of a good thing is expensive for taxpayers. Leverett is filling its coffers more slowly and maintains a much lower tax rate than Shutesbury--$20.39 compared to Shutesbury’s $23.37. 


It appears we are paying dearly to have those reserves bulked up year after year. What motivates Shutesbury to sock away money to such an extravagant extent? There seems to be a story here, which I’ll examine next time.


Monday, July 19, 2021

Shutesbury vs. Leverett: Round Two


At first glance, the current budgets of Shutesbury and Leverett look very similar. There are many of the same primary categories:  Public Safety/Protection of Persons & Property, Education, Public Works/DPW, and Culture and Recreation. The total budget amount is also similar:  $6.63 million for Shutesbury and $6.54 million for Leverett. For both towns, the budget request amounts for the categories just described are similar.


There are other expense categories where the two towns diverge. Debt, General Government, and Miscellaneous are three areas where there are stark differences. Another area of interest is the amount in each town’s cash reserves.


Let’s take a look at each section side by side and compare.


General Government


General Government is the first category listed on each town’s budget and encompasses the salaries and expenses associated with Town Hall employees, boards and committees. For Shutesbury, the requested amount for fiscal year 2022 was $563,704; for Leverett, $357,419. 


That’s a whopping 37% higher cost for Shutesbury’s General Government than Leverett’s. Where is that $206K hidden?


Here are some of the expense categories/departments where there are large differences in the budgets of Shutesbury compared to Leverett:


  • Selectboard: $37,745 v. $28,679;

  • Town Administrator: $68,763 v. $88,849;

  • Finance Committee reserves: $75,000 v. $40,000;

  • Assessors: $58,959 v. $49,425;

  • Treasurer: $52,446 v. $32,492;

  • Collector: $47,968 v. $28,976;

  • Town Counsel: $15,000 v. $6,000;

  • Land Use Clerk (Shutesbury only): $15,126;

  • Town Buildings: $57,152 v. $72,176 (added together from several departments);

  • Other General Government (Shutesbury only): $19,742


These items account for about half of the $206,000 difference between the two budgets. It should be noted that in the case of the Finance Committee reserve fund, any leftover money is moved to Free Cash at the end of the fiscal year. 


There are many other categories in which Shutesbury budgets more than Leverett; I chose to highlight the ones with larger amounts in an effort to identify why there is such a disparity between the towns’ budgets.


It appears that Shutesbury is more generous with salaries, stipends, and expenses than is Leverett. This is not necessarily a bad thing--but it does cost money, and lots of it.


Miscellaneous 


Shutesbury’s funding in the Miscellaneous category far exceeds that of Leverett: $1,077,620 compared with Leverett’s $466,764. 


A cursory look identifies two hefty expenses for our town: Health Insurance, at $520,000, and County Retirement, at $237,000. Comparable expenses for Leverett show $136,000 for the former and $112,918 for the latter.


These two categories alone cost Shutesbury taxpayers over $500,000 more every year than they cost the taxpayers in Leverett.


There are other large expenses. Shutesbury’s Medicare tax, listed as $42,064, is much larger than Leverett’s $9,904, while its OPEB (Other Post-Employment Benefits) fund contribution is a huge $50,000 while Leverett’s is a mere $10,000. Town insurance will cost Shutesbury taxpayers $68,000 this fiscal year, compared with $41,000 for Leverett’s citizenry. And there is also the annual taxpayer contribution to Shutesbury’s Library Building fund, in the amount of $25,000.


Can Shutesbury reduce any of these expenses? For instance, could we get a better deal on employee health insurance? With this type of expense rising every year, this issue deserves consideration.


Correction: A reader noted that health and other insurance costs are listed in both Miscellaneous and the Education categories in the Leverett budget. When totaled, insurance costs level out between the two towns. Education costs in Shutesbury, however, become much higher--but that's a subject for another day.


Debt


Leverett shoulders a heavy debt load compared to Shutesbury:  $380,259 for fiscal year 2022. The interest portion of that debt amounts to $72,759. By contrast, Shutesbury currently owes $20,435 in Water Pollution Abatement Trust loans to aid homeowners with failed septic systems, as well as $2,000 in short-term notes.


In 2012, Leverett voted to take out $3.6 million in long-term bond debt in order to pay for its broadband network, which likely accounts for its higher debt load. 


Though less debt is generally a good thing, Leverett’s debt load is far lower than the state’s limit of 5% of equalized values, i.e., the total value of all property in a city or town. Currently, Leverett’s percentage sits at .13%.


Next time, we’ll take a look at each town’s Reserve Funds: how they differ, how they arrived at their current levels, and how those levels affect taxpayers and town finances. 


Monday, July 12, 2021

One Big Way Shutesbury and Leverett Differ


Shutesbury and Leverett are similar in their rural nature, unique home styles, and comparable populations. Along with Amherst and Pelham, Shutesbury and Leverett make up the Amherst-Pelham Regional School District. 


A closer comparison of the two towns finds some key differences, as well--most of them financial. Of the two, Leverett is the wealthier, has far more debt and fewer cash reserves than Shutesbury, and appears to spend much less than Shutesbury on General Government and Unclassified/Miscellaneous budget items despite the two towns having comparable fiscal year budget totals ($6,565,414 for Leverett and $6,601,022 for Shutesbury in FY2020). Education expenses of $3,980,966 for Leverett and $3,984,136 for Shutesbury were intentionally left off the chart to improve readability.


The Property Wealth Gap


Sorting for Shutesbury and Leverett on the Division of Local Services’ data page, the differences between the two towns are easy to see. Looking at just the last 10 fiscal years shows Shutesbury lagging Leverett in every financial category. 


For example, Leverett’s cumulative single family value has increased quite steadily since 2012, from nearly $195,000,000 to over $211,000,000 in 2021. While that may seem like a small increase over a decade, it represents a huge gain over Shutesbury, where aggregate value actually declined. Today’s value sits at a little over $187,000,000, a precipitous drop from 2012’s $194,000,000.


In 2017, Shutesbury’s value took a dive to just under $180,000,000 from the previous year’s total of $191,000,000--and only partially recovered thereafter, putting us even further behind Leverett.


Naturally, the value of the average single family home in Shutesbury has been historically less than that of Leverett. Between 2012 and 2019, the difference in value was sizable--in the $50,000 to $60,000 range. In 2020 and 2021, Leverett’s values shot up by $11,000 and $18,000, respectively, over 2019 values. The value of the average Shutesbury home stayed nearly the same, widening the wealth gap with Leverett even more.


The Income Gap


Per capita incomes in Shutesbury have always been lower than incomes in Leverett. Both towns have seen a general rise over the past 10 years in annual income, but Shutesbury is in no danger of catching up to Leverett. 


For Leverett and Shutesbury, 2012 per capita incomes were $34,333 and $20,662, respectively. By 2021, Leverett’s per capita income was $47,510 per year, while Shutesbury’s was only $26,831. This $20,000-plus difference doesn’t reduce our tax burden relative to our neighbor, however.


The average single family tax bill for both towns has been gradually increasing over the past decade except for 2021, when Leverett’s dropped by less than $100 and Shutesbury’s by approximately $300. Our average bill of $5,662 for fiscal year 2021 was only about $800 less than Leverett’s $6,368; in 2020, the difference was around $500.


Lower incomes and high tax bills mean the folks in Shutesbury have to fork over more of their yearly salaries to pay their taxes than do the taxpayers in Leverett. Averaged over the 10-year period of 2012 to 2021, we in Shutesbury paid 23.04% of our annual incomes in property taxes while Leverett property owners paid only 16.71%. The difference was especially stark in fiscal year 2021 when we paid 21.10% of income in local taxes while our neighbors paid a minuscule (by comparison) 13.40%.


You won’t be surprised to learn that as a percentage of value, Shutesbury property owners pay higher rates than people in Leverett. In fiscal year 2012, we paid 1.96% of our property value in taxes while Leverett paid 1.78%. In 2021, we paid 2.26% of value in taxes--which would have been higher if the town hadn’t moved $220,000 in Free Cash to lower the tax rate. In Leverett, that factor was 1.97%.


Over the past decade, Leverett’s tax rate has been lower than Shutesbury’s, as well--even when they were building out their broadband infrastructure. For fiscal year 2022, their tax rate is $20.40, while ours is $23.37.


Can’t get enough of the contrasts between our town and Leverett? Tune in next time when I compare debt, savings, personnel costs, and other budgetary goodies.  


Tuesday, July 6, 2021

Small Town, Big Government


For small towns like Shutesbury, the lion’s share of revenues is allocated to education, and the local government is often run by part-time employees and volunteers. If the population (and tax base) grows, it stands to reason that town government will also expand. If the number of residents stays the same or decreases, you can reasonably expect the cost of local government to follow in step.


According to the Donohue Institute at UMASS Amherst, Shutesbury’s population decreased by 1.18% between 2010 and 2019, while general government costs have increased from approximately $294,000 in 2010 to $484,000 in 2019. 


That’s a big increase, so I decided to look at other Franklin County towns with similar populations. I teased out Ashfield, Leverett, and Shelburne to see how their populations and government expenses have changed over the same timeframe.


Population numbers are from 2018 and costs and expenses are rounded up or down to the nearest thousand. DLS Gateway links load to default pages, so sort by town and/or topic to check references for each town and subject discussed.


Ashfield: Population 1,734


The cost of local government for Ashfield climbed from $246,000 in 2012  to $434,000 in 2019 (information was unavailable for 2010 and 2011). General Fund expenditures for General Government equaled 9.76% of the town’s budget in 2019, with 57.33% going to education and 15.33% allocated to Public Works.


Ashfield’s population decreased by 1.10% between 2010 and 2019.


Leverett: Population 1,861


Our neighbor, Leverett, saw its government costs increase from $290,000 in 2010 to $386,000 in 2019. Between 2014 and 2017, yearly costs jumped around from about $418,000 to $500,000 before settling in at $355,000 in 2018. Those increased costs were likely due to the building of the town’s broadband network. For 2019, General Government made up 6.07% of Leverett’s annual budget while education took the biggest chunk at 62.21%.


Leverett’s population decrease from 2010 to 2019 was quite small--a mere 0.37%.


Shelburne: Population 1,861


In 2010, Shelburne’s General Government costs were $273,000. Costs have increased each year (excluding missing data for 2012 and a jump to $427,000 in 2015) to the 2019 total of $415,000. Education used 52.60% of Shelburne’s 2019 budget and General Government’s share was 9.00%.


Shelburne lost 3.36% of its population between 2010 and 2019, a big loss compared with the other towns profiled in this post.


Shutesbury: Population 1,774


Breaking down Shutesbury’s $484,000 in General Fund expenditures in 2019 shows our Education expenses slightly lower than Leverett’s (59.66%) and General Government coming in at 7.38%.


What stands out here is that Shutesbury’s increase in funding for General Fund expenditures has been steadily increasing each year since 2010. The other towns increase or decrease funding from one year to another, likely in response to local projects and priorities.


Shutesbury’s fiscal year expense budget shows close to $564,000 in General Fund expenditures set aside for FY 2022.


Upon closer inspection of the “Unclassified” category on the DLS Gateway, I see that Shutesbury’s numbers are far higher than the other three towns under consideration.


What are “Unclassified” expenses? According to the Community Comparison Spending by Function page:


Unclassified = Fixed costs + Intergovernmental + Other expenses


ClearGov describes this expense segment as “unknown or a mixture of more than one expense type”.


Since 2010 (excluding the aforementioned missing data), all four towns have seen their Unclassified totals move in an upward trajectory. Shutesbury differs in that its 2010 dollar amount was quite high--$610,000--compared to Leverett’s total of $290,000; Shelburne’s   $242,000 total was lower still. Ashfield’s data for 2010 and 2011 is missing, but its 2012 total was a mere $210,000.


By the process of elimination, I found that “Unclassified” expenditures on the DLS website are almost identical to those categorized as “Miscellaneous” on Shutesbury’s expense budget.


Next time, I’ll take a look at how Shutesbury’s high expense categories compare with those of our wealthier neighbor, Leverett.


Information Mining on Shutesbury.org

Photo by Kenny Eliason on Unsplash Municipal websites provide a wealth of information for citizens willing to explore what they offer. Thou...